EPoX EP-5P945 PRO: Budget 945P Performance
by Gary Key on September 11, 2006 4:45 AM EST- Posted in
- Motherboards
Gaming Performance
While Sandra and SuperPI provide useful information on how memory performs without the influence of other components, our first round of real world tests has shown there is not a noticeable difference in performance between DDR2-533 and DDR2-667 operation on the EPoX board. In fact, the overall differences at stock FSB settings are really minor between all of the boards. However, our next set of real-world benchmarks consists of gaming benchmarks.
We are utilizing Half Life 2 and Quake 4 in our testing because they are typically more sensitive to memory bandwidth changes and can potentially show how well a particular chipset performs. We added Serious Sam II to our benchmark mix because it is more GPU dependent, but we will see the effects of an optimized board in this game. We tested at the 1024x768 resolution with High Quality settings in order to reduce the effects of the video card on our motherboard testing. We found the 7600GS to be GPU limited at 1280x1024 but it still provided a decent gaming experience with scores dropping off around 30% on average but still remaining around the 60FPS level.
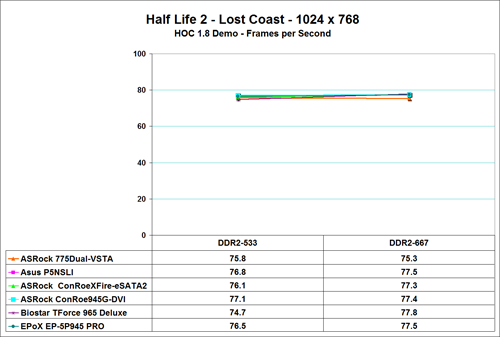
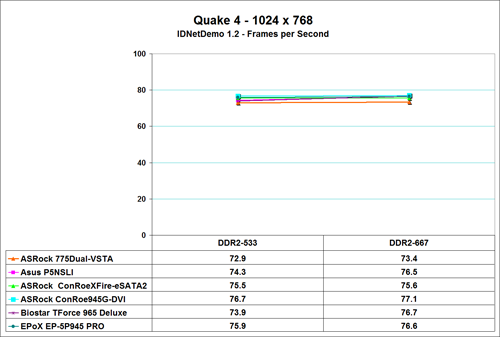
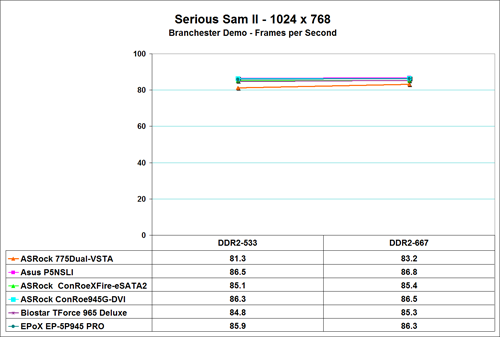
Our two memory sensitive games show a continuing pattern with the EPoX EP-5P945 PRO motherboard performing very well at both memory settings in Quake 4 and Half Life 2 - Lost Coast. The board finished second in Quake 4 and third in HL2-Lost Coast. The EPoX board finishes third in Serious Sam II where the Asus P5NSLI leads the test group. Once again, the difference between all of the boards and memory speeds are minor and only noticeable with benchmarks. Basically, your purchase decision should be based on price, features, availability, warranty, support, and manufacturer more than gaming performance.
While Sandra and SuperPI provide useful information on how memory performs without the influence of other components, our first round of real world tests has shown there is not a noticeable difference in performance between DDR2-533 and DDR2-667 operation on the EPoX board. In fact, the overall differences at stock FSB settings are really minor between all of the boards. However, our next set of real-world benchmarks consists of gaming benchmarks.
We are utilizing Half Life 2 and Quake 4 in our testing because they are typically more sensitive to memory bandwidth changes and can potentially show how well a particular chipset performs. We added Serious Sam II to our benchmark mix because it is more GPU dependent, but we will see the effects of an optimized board in this game. We tested at the 1024x768 resolution with High Quality settings in order to reduce the effects of the video card on our motherboard testing. We found the 7600GS to be GPU limited at 1280x1024 but it still provided a decent gaming experience with scores dropping off around 30% on average but still remaining around the 60FPS level.
Our two memory sensitive games show a continuing pattern with the EPoX EP-5P945 PRO motherboard performing very well at both memory settings in Quake 4 and Half Life 2 - Lost Coast. The board finished second in Quake 4 and third in HL2-Lost Coast. The EPoX board finishes third in Serious Sam II where the Asus P5NSLI leads the test group. Once again, the difference between all of the boards and memory speeds are minor and only noticeable with benchmarks. Basically, your purchase decision should be based on price, features, availability, warranty, support, and manufacturer more than gaming performance.


23 Comments
View All Comments
yacoub - Monday, September 11, 2006 - link
I find it... I dunno... strange that you break out a zero-anchor graph for the gaming tests when normally in reviews you guys use a tighter graph that does not start at zero and thus makes the difference between performance seem great.I guess what I find funny is that if you used that type of graph in all of your reviews, many parts reviewed would show their true improvement which is often very very little. This reviews shows how this board barely performs any worse than the other boards charted, yet if you'd used the older method of a graph starting at, say, '60' instead of '0' people would think OMG there's a HUGE difference.
Maybe what I'm trying to say is thanks for finally using a zero-anchored graph to show true performance delta instead of a zoomed in graph where the same charts would appear to have wide difference between part performance when they really don't.
yacoub - Monday, September 11, 2006 - link
Here's what I'm talking about in comparison if anyone is wondering:http://www.anandtech.com/mb/showdoc.aspx?i=2826&am...">http://www.anandtech.com/mb/showdoc.aspx?i=2826&am...
Gary Key - Monday, September 11, 2006 - link
Hi,We do listen (sometimes the message takes a while to sink in) and decided to do away with the non-zero based graph or even a zoom in in this case. Although we clearly stated our purpose with the non-zero based graphs and provided one (if clicked) it appeared from comments this offering was not satisfactory either. Hopefully, we will have an updated graphing engine in the near future so this type of information can be presented in a different fashion. Thanks for the comments!
:)