EPoX EP-5P945 PRO: Budget 945P Performance
by Gary Key on September 11, 2006 4:45 AM EST- Posted in
- Motherboards
Application Performance
We also test motherboards with a few real world applications that typically stress the CPU, memory, and storage systems to see if the results from our synthetic memory tests carry over to the desktop. Our tasks include three activities that are common on the desktop.
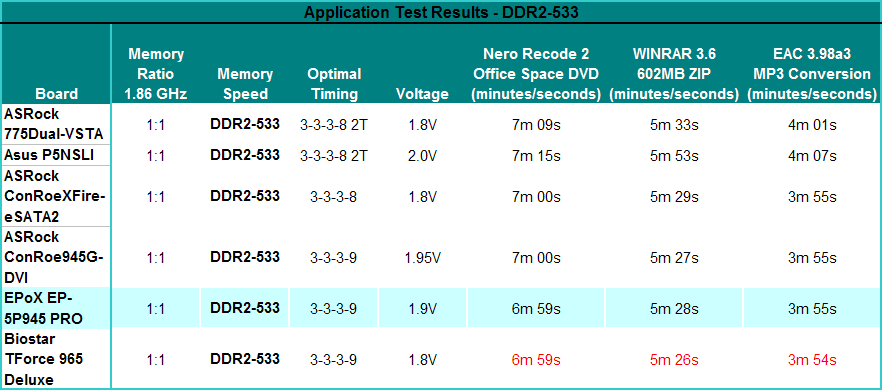
Our first test was to measure the time it takes to shrink the entire Office Space DVD that was extracted with AnyDVD into a single 4.5GB DVD image utilizing Nero Recode 2. Our second test utilizes WinRAR 3.6 and measures the time it takes to compress our test folder that contains 444 files, 10 folders, and has 602MB of data.
Our third test consists of utilizing Exact Audio Copy as the front end for our version 3.98a3 of LAME. We set up EAC for variable bit rate encoding, burst mode for extraction, use external program for compression, and to start the external compressor upon extraction (EAC will read the next track while LAME is working on the previous track, thus removing a potential bottleneck with the optical drive). Our test CD is INXS Greatest Hits containing 16 tracks totaling 606MB of songs. The results of our tests are presented in minutes/seconds with lower numbers being better.
Our application test results mirror those of the synthetic results where the EPoX board scores better than the ASRock ConRoeXFire-eSATA2 based on the same 945P chipset but trails slightly behind the ASRock ConRoe945G-DVI board. The EPoX board is scoring consistently near the top in these tests. The differences between DDR2-533 and DDR2-667 memory is minor so we suggest utilizing low latency DDR2-533 with this board and utilizing the money saved on your GPU choice. Overall, the EPoX board performs well and can be considered a solid choice if your budget is limited.
We also test motherboards with a few real world applications that typically stress the CPU, memory, and storage systems to see if the results from our synthetic memory tests carry over to the desktop. Our tasks include three activities that are common on the desktop.
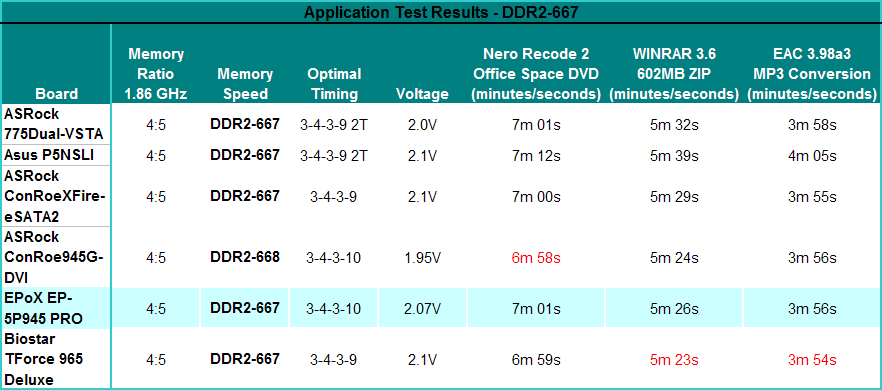
Our first test was to measure the time it takes to shrink the entire Office Space DVD that was extracted with AnyDVD into a single 4.5GB DVD image utilizing Nero Recode 2. Our second test utilizes WinRAR 3.6 and measures the time it takes to compress our test folder that contains 444 files, 10 folders, and has 602MB of data.
Our third test consists of utilizing Exact Audio Copy as the front end for our version 3.98a3 of LAME. We set up EAC for variable bit rate encoding, burst mode for extraction, use external program for compression, and to start the external compressor upon extraction (EAC will read the next track while LAME is working on the previous track, thus removing a potential bottleneck with the optical drive). Our test CD is INXS Greatest Hits containing 16 tracks totaling 606MB of songs. The results of our tests are presented in minutes/seconds with lower numbers being better.
 |
 |
| Click to enlarge |
Our application test results mirror those of the synthetic results where the EPoX board scores better than the ASRock ConRoeXFire-eSATA2 based on the same 945P chipset but trails slightly behind the ASRock ConRoe945G-DVI board. The EPoX board is scoring consistently near the top in these tests. The differences between DDR2-533 and DDR2-667 memory is minor so we suggest utilizing low latency DDR2-533 with this board and utilizing the money saved on your GPU choice. Overall, the EPoX board performs well and can be considered a solid choice if your budget is limited.


23 Comments
View All Comments
yacoub - Monday, September 11, 2006 - link
I find it... I dunno... strange that you break out a zero-anchor graph for the gaming tests when normally in reviews you guys use a tighter graph that does not start at zero and thus makes the difference between performance seem great.I guess what I find funny is that if you used that type of graph in all of your reviews, many parts reviewed would show their true improvement which is often very very little. This reviews shows how this board barely performs any worse than the other boards charted, yet if you'd used the older method of a graph starting at, say, '60' instead of '0' people would think OMG there's a HUGE difference.
Maybe what I'm trying to say is thanks for finally using a zero-anchored graph to show true performance delta instead of a zoomed in graph where the same charts would appear to have wide difference between part performance when they really don't.
yacoub - Monday, September 11, 2006 - link
Here's what I'm talking about in comparison if anyone is wondering:http://www.anandtech.com/mb/showdoc.aspx?i=2826&am...">http://www.anandtech.com/mb/showdoc.aspx?i=2826&am...
Gary Key - Monday, September 11, 2006 - link
Hi,We do listen (sometimes the message takes a while to sink in) and decided to do away with the non-zero based graph or even a zoom in in this case. Although we clearly stated our purpose with the non-zero based graphs and provided one (if clicked) it appeared from comments this offering was not satisfactory either. Hopefully, we will have an updated graphing engine in the near future so this type of information can be presented in a different fashion. Thanks for the comments!
:)