CrossFire Xpress 3200: RD580 for AM2
by Wesley Fink on June 1, 2006 12:05 AM EST- Posted in
- Motherboards
General Performance
With the Memory Controller on the Athlon 64 Processor, Winstone benchmarks are no longer very revealing of motherboard performance. With the same CPU (and the same memory controller on that CPU) Winstones, both Business and Multimedia Content Creation, are tightly clustered. The only deviation from that is that boards that are tweaked for best gaming performance are often near the bottom of a tight range of benchmark performance numbers. The Winstone tests themselves are rapidly becoming dated, and are no longer supported by PC Magazine. While Winstones are still useful in providing real world performance data we are dropping Winstones from our standard motherboard test suite.
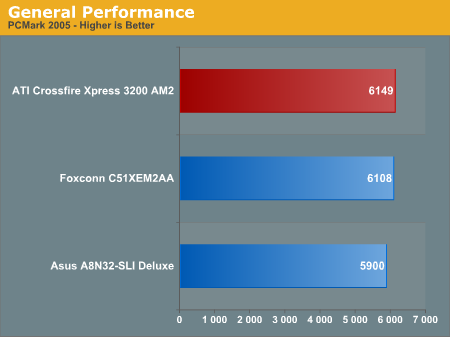
PCMark 2005 results with the ATI AM2 show the CrossFire Xpress 3200 AM2 with a 40 point lead. The nForce 590 and ATI AM2 should be considered equivalent in performance. Both show a 200+ point lead over the DDR-based Asus A8N32-SLI, consistent across both AM2 platforms.
Despite the close results in these tests, PCMark05 is proving to be a useful overall performance benchmark. It is generally more sensitive than the older Winstones and PCM04 to recent improvements in PC architecture. PCMark 05 results in general relate well to the other performance results we find in our board tests - providing a quick and reliable snapshot of board performance compared to other motherboards.
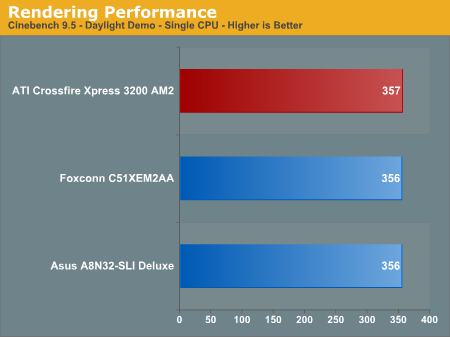
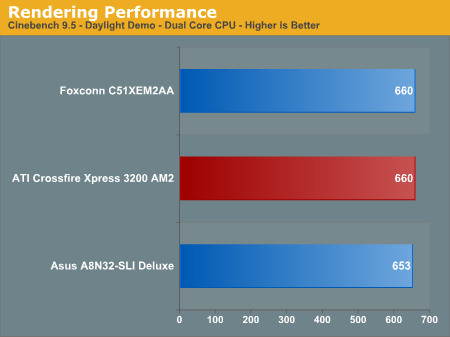
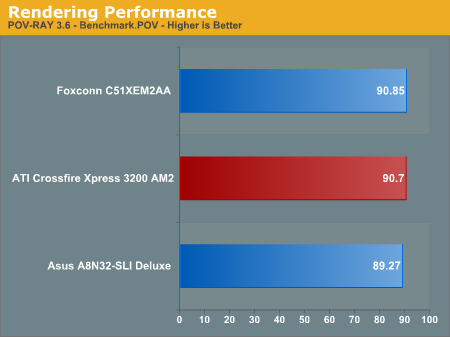
We have replaced Winstones with 2 benchmarks that use rendering to test system performance. Cinebench 9.5 and POV-RAY 3.6 benchmarks both heavily stress the CPU subsystem while performing graphics modeling and rendering. We utilize the standard benchmark demos in each program along with the default settings. Cinebench 9.5 features two different benchmarks with one test utilizing a single core and the second test showcasing the power of multiple cores in rendering the benchmark image.
Single-Core and POV-Ray results are extremely close across DDR and DDR2 platforms. However, Dual-Core Cinebench results show both NVIDIA and ATI AM2 chipsets with a larger lead over the DDR platform. Since all 3 systems were tested with a dual-core CPU at the same speed, this provides a bit of evidence that dual-core (and quad core potentially) can make better use of the extra DDR2 memory bandwidth.
3D Graphics
The 3DMark benchmarks, published by Futuremark, are probably the most widely quoted gaming performance benchmarks available. While the benchmarks are based on game sequences written by Futuremark to reveal subtle differences in gaming performance, they still have to be considered synthetic benchmarks. They are useful for broad graphics comparisons, but they are no substitute for benchmarks with real gaming engines that are currently being played.
SLI and CrossFire are also generally supported in 3DMark, but we ran 3DMark2005 and 2006 in standard mode only as we are not comparing SLI and CrossFire in this chipset review. Please take a closer look at CrossFire benchmarks later in this review for comparisons of CrossFire and SLI performance in several current games. 3DMark06 was recently introduced and you can find more in-depth information about this new 3DMark in the AnandTech article Futuremark's Latest Attempt: 3DMark06 Tested.


The 05 and 06 results both show the ATI AM2 in the lead, but the margin is small enough to be within the margin of error. Again, both AM2 boards outperform the DDR platform by several hundred points. The ATI and NVIDIA AM2 boards can be considered a dead heat in 3D Graphics performance.
Encoding
We have found encoding results are not affected by the graphics card used during the encoding benchmarks. This is demonstrated again and again by archive test results for AutoGK using an AMD 4000+ processor with a wide assortment of video cards. The performance range of those encoding tests is just 48.1 to 49.1 - a difference form high to low of just 1.0 frame. Clearly the biggest influence on this encoding benchmark is the CPU used for testing. Because encoding test results vary so little on the same standardized motherboard test platform, they have been dropped from this review and future reviews. Encoding tests are very useful in CPU testing, but they have been shown to be poor motherboard tests - particularly on the AMD platform with the memory controller on the CPU.
With the Memory Controller on the Athlon 64 Processor, Winstone benchmarks are no longer very revealing of motherboard performance. With the same CPU (and the same memory controller on that CPU) Winstones, both Business and Multimedia Content Creation, are tightly clustered. The only deviation from that is that boards that are tweaked for best gaming performance are often near the bottom of a tight range of benchmark performance numbers. The Winstone tests themselves are rapidly becoming dated, and are no longer supported by PC Magazine. While Winstones are still useful in providing real world performance data we are dropping Winstones from our standard motherboard test suite.
PCMark 2005 results with the ATI AM2 show the CrossFire Xpress 3200 AM2 with a 40 point lead. The nForce 590 and ATI AM2 should be considered equivalent in performance. Both show a 200+ point lead over the DDR-based Asus A8N32-SLI, consistent across both AM2 platforms.
Despite the close results in these tests, PCMark05 is proving to be a useful overall performance benchmark. It is generally more sensitive than the older Winstones and PCM04 to recent improvements in PC architecture. PCMark 05 results in general relate well to the other performance results we find in our board tests - providing a quick and reliable snapshot of board performance compared to other motherboards.
We have replaced Winstones with 2 benchmarks that use rendering to test system performance. Cinebench 9.5 and POV-RAY 3.6 benchmarks both heavily stress the CPU subsystem while performing graphics modeling and rendering. We utilize the standard benchmark demos in each program along with the default settings. Cinebench 9.5 features two different benchmarks with one test utilizing a single core and the second test showcasing the power of multiple cores in rendering the benchmark image.
Single-Core and POV-Ray results are extremely close across DDR and DDR2 platforms. However, Dual-Core Cinebench results show both NVIDIA and ATI AM2 chipsets with a larger lead over the DDR platform. Since all 3 systems were tested with a dual-core CPU at the same speed, this provides a bit of evidence that dual-core (and quad core potentially) can make better use of the extra DDR2 memory bandwidth.
3D Graphics
The 3DMark benchmarks, published by Futuremark, are probably the most widely quoted gaming performance benchmarks available. While the benchmarks are based on game sequences written by Futuremark to reveal subtle differences in gaming performance, they still have to be considered synthetic benchmarks. They are useful for broad graphics comparisons, but they are no substitute for benchmarks with real gaming engines that are currently being played.
SLI and CrossFire are also generally supported in 3DMark, but we ran 3DMark2005 and 2006 in standard mode only as we are not comparing SLI and CrossFire in this chipset review. Please take a closer look at CrossFire benchmarks later in this review for comparisons of CrossFire and SLI performance in several current games. 3DMark06 was recently introduced and you can find more in-depth information about this new 3DMark in the AnandTech article Futuremark's Latest Attempt: 3DMark06 Tested.
The 05 and 06 results both show the ATI AM2 in the lead, but the margin is small enough to be within the margin of error. Again, both AM2 boards outperform the DDR platform by several hundred points. The ATI and NVIDIA AM2 boards can be considered a dead heat in 3D Graphics performance.
Encoding
We have found encoding results are not affected by the graphics card used during the encoding benchmarks. This is demonstrated again and again by archive test results for AutoGK using an AMD 4000+ processor with a wide assortment of video cards. The performance range of those encoding tests is just 48.1 to 49.1 - a difference form high to low of just 1.0 frame. Clearly the biggest influence on this encoding benchmark is the CPU used for testing. Because encoding test results vary so little on the same standardized motherboard test platform, they have been dropped from this review and future reviews. Encoding tests are very useful in CPU testing, but they have been shown to be poor motherboard tests - particularly on the AMD platform with the memory controller on the CPU.


71 Comments
View All Comments
Gary Key - Thursday, June 1, 2006 - link
Wes's original hard drive met an untimely death during testing. However, the chart is incorrect as the Maxtor drive has a 16MB cache also and in our IPEAK tests the two drives are very comparable if not the same. We did not see any differences in the game scores and PCMark was off about 20 points, well within the margin of error for testing for this application.